Last week I reported on the results of my recommendations for the month of November. All together, the picks were up 40% for the month. While that sounds amazing, let’s have a reality check. Those results would only happen if the picks were made sequentially (ie buy one, then sell, then buy another, then sell etc) and if you put 100% of your portfolio on each pick. Neither scenarios are realistic. First, many of the picks overlap in time frame and second, never put more than 10% of your portfolio on one pick to mitigate risk. If you were to diversify with the 10% rule and if you were able to buy and sell each pick, you would have realized a 4% profit for the month which is 48% for the year. If you were to use margin, you could see an annualized return of 96% to 144% depending on the margin factor. I also said that I had made a slight revision in the program to enhance returns. It’s that revision that I would like to explain.
The essence of the program has not changed. We still restrict ourselves to companies that make up the S&P 500 only. We look at the slope of the MACD of the Large Cap Index to determine if we go long or short. We continue to look at 50 and 200-day moving averages. Finally, we look at the MACD of the individual company. Before, we would want to see it go from negative to positive territory; retrace above the zero line and then buy it on the intersection of the MACD lines. Here is the revision. Instead of buying it on the MACD intersection, buy it as the Histogram changes positively.
The histogram are the blue bars pivoting above and below the zero line. They measure the difference between the faster moving black MACD line and the slower moving red MACD line. When the red and black MACD lines intersect, the histogram is exactly zero. When the red and black lines are furthest away, the histogram will either peak or trough.
Here is the exact day to buy. Both the red and black MACD lines go from negative to positive territory. The black MACD line then retreats and intersects the slower red line but the red line is still in positive territory. Since the black line is below the red line, the histogram is below the zero line. Once the histogram shows improvement from the trough (or lowest point), that is the precise day to buy the stock. You do not need to see the lines intersect as per the original program.
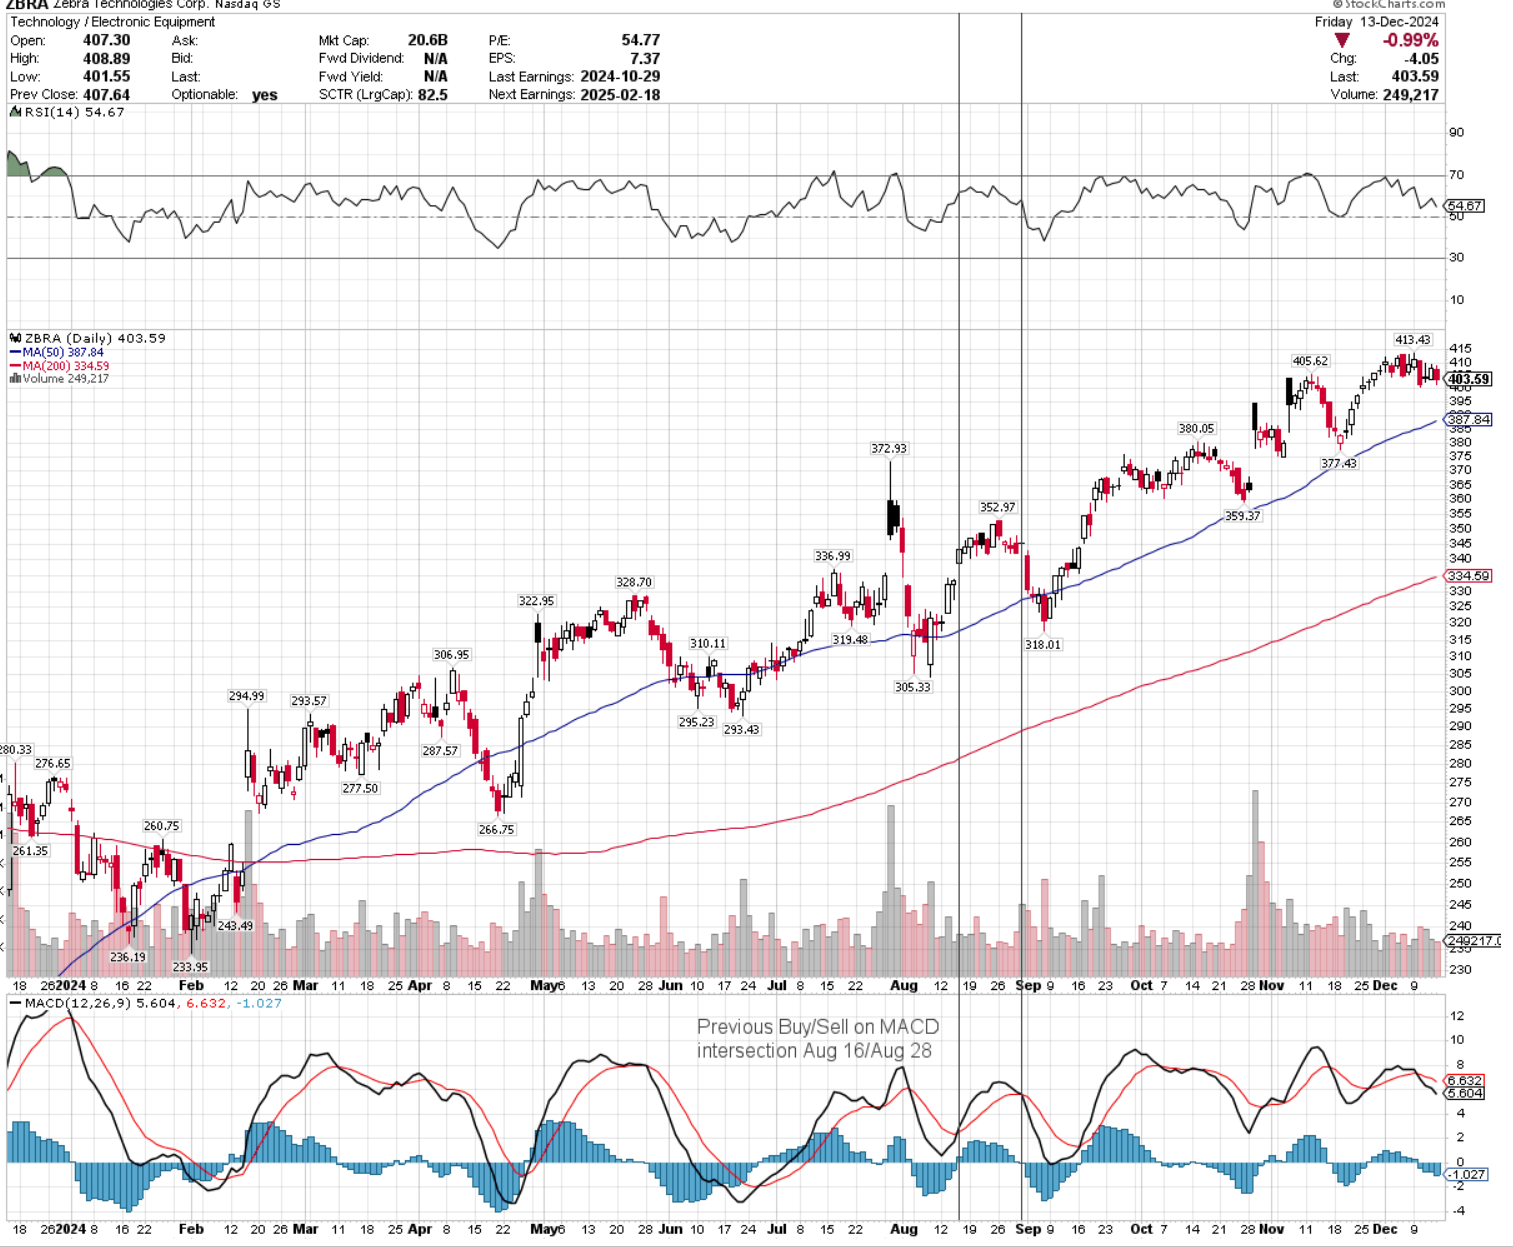
Here is a real-life example. Below is the chart for Zebra Technologies. Under the previous plan, we ensure that Zebra is part of the S&P 500. On August 8, the slope of the MACD of the Large Cap Index was positive. Zebra’s 50-day average is above its 200-day average. Its MACD was in negative territory in June and went positive in July. The black line then retraced yet the red line remained in positive territory. When the red and black MACD lines intersected above the zero line, our previous buy date would have been August 16. We would have bought it at 342.32. The stock surpassed its 2% goal, but the stop loss was triggered the next day and was sold at 349.17 getting our 2% return.

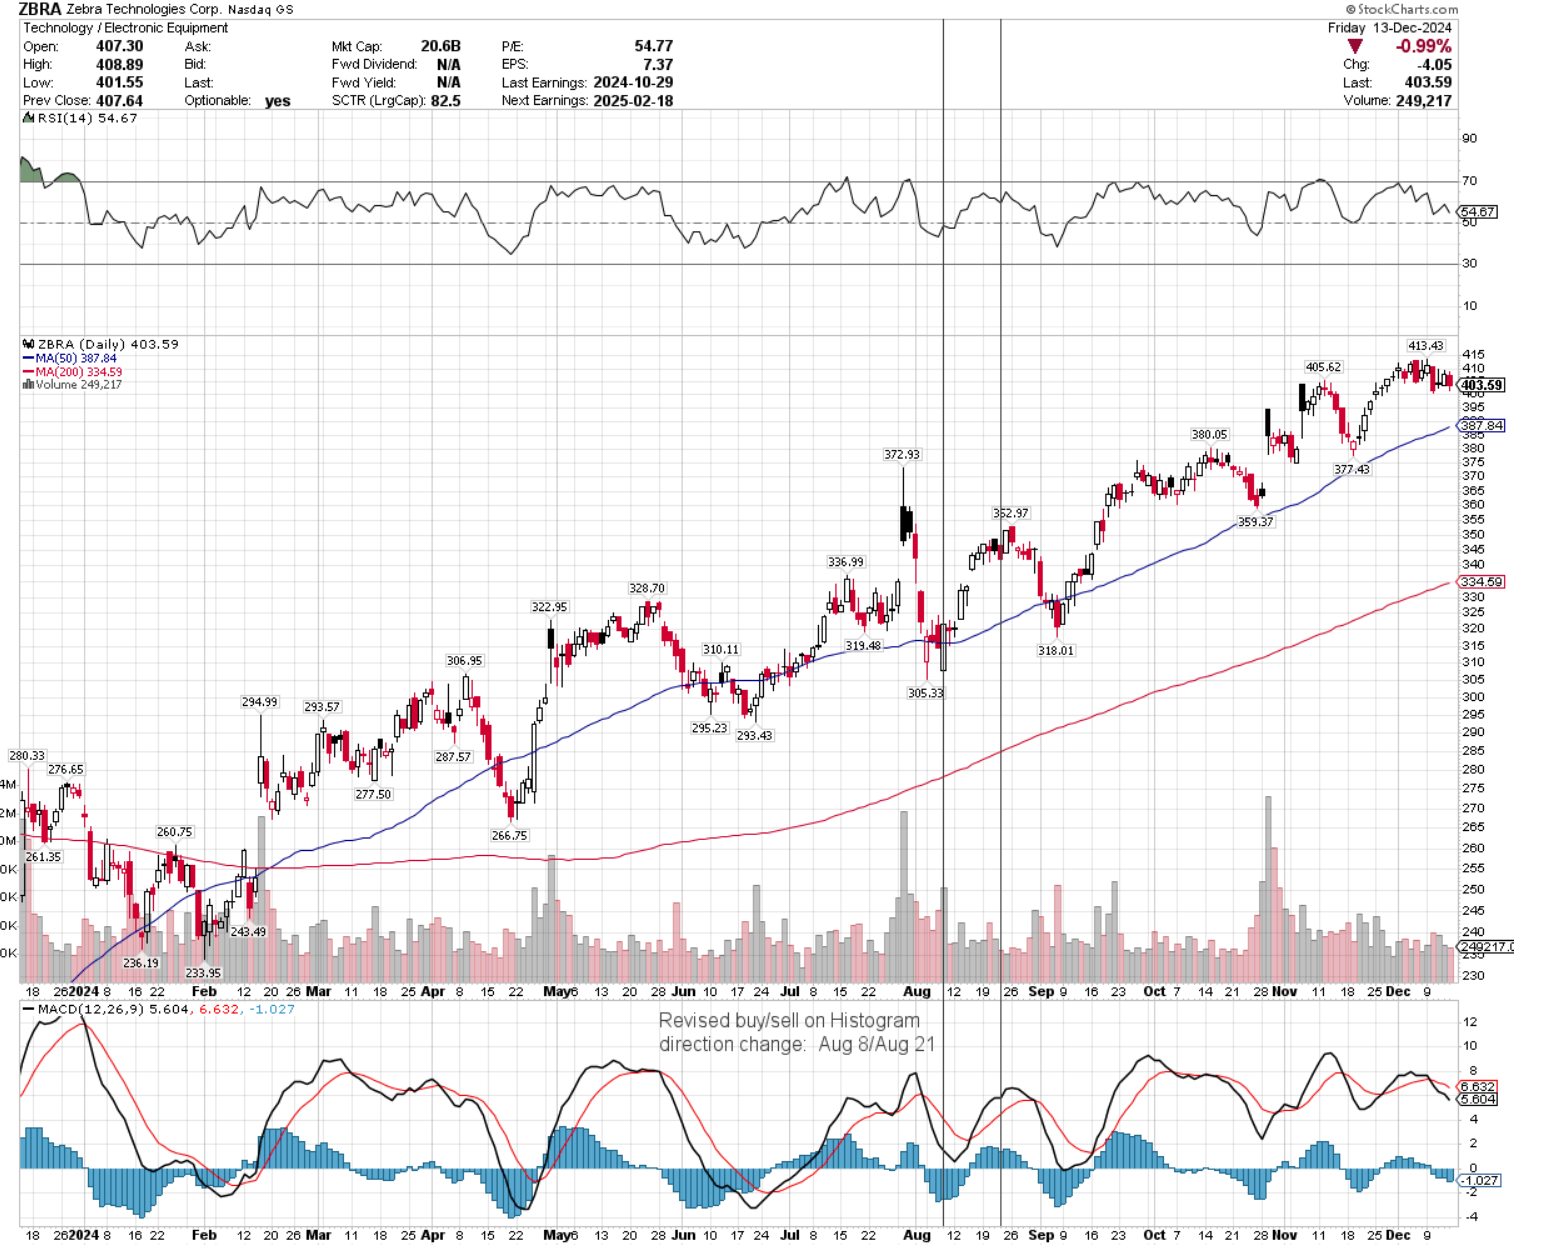
Now let’s look at the one modification we are using. Below is the same chart, but instead of buying the stock on the MACD intersection, we are buying it the precise day the histogram improves. On August 8 (eight days earlier) the histogram bar improved, and we bought the stock at 307.73. We rode the stock for 9 days until the stop loss was triggered. In this case, we made 11.19%. This is an amazing improvement over the original 2% return.

The main advantage to this revision is that we will catch the upswings 3-5 days earlier than before generating greater returns. There will also be fewer instances where we have a maximum 3% loss. The histogram will change direction many times before that happens giving the sell signal.
The main disadvantage is that there will be more false signals. Buying one day then selling the next. However, the advantages far outweigh the disadvantages generating greater returns with fewer 3% losses. At the end of the day, we continue to be focussed on our main goal and that is to generate 2% returns per week with little to no risk. Over a year, that results in a 100%+ return.
We look forward to presenting our back tested results for the entire 2024 calendar year in the coming weeks.
Go to twopercentgoal.com and sign up for the daily email. It is free for the first 30 days and then $99/month thereafter.
While the test data is overwhelmingly positive, there are risks with this type of investing and the author accepts no responsibility for any possible losses.
Cheers,
Al
Recent Posts
Thank You Jeff Daniels
Thanks Jeff Daniels for telling it like it
What I Have Learned On My One Year Anniversary Writing Blogs
Writing blogs for one year has made me wiser
On Balance Volume Now Part of the Toolbox
Adding On Balance Volume to the arsenal
DISCLAIMER
Opinions and data provided are subject to change without prior notice. These opinions might not be suitable for every investor. It’s important to conduct your own research and consult with a registered broker or investment advisor. Information on various stocks, options, futures, bonds, derivatives, commodities, currencies, and other financial instruments (collectively, “Securities”) is shared here to potentially interest the audience. This content is meant for informational purposes only and does not constitute investment advice or recommendations. The buying or selling of any securities is not solicited. Additionally, none of these activities should be interpreted as providing financial advice. The information presented should not be taken as a suggestion to buy, hold, or sell any specific securities. Investing in securities comes with risks and market volatility. Past performance is not indicative of future results. It is strongly encouraged to conduct your own due diligence.

